How to Install Prometheus on Ubuntu 24.04 (Step by Step)
Install Prometheus 3.13 on Ubuntu 24.04 as a hardened systemd service: dedicated user, firewall, reboot-tested. Every command verified in our lab.
Prometheus is the metrics database at the centre of most modern monitoring setups: it scrapes numbers out of your servers and apps every few seconds, stores them, and lets you graph and alert on them. This guide installs it properly on a single Ubuntu 24.04 VPS — not “download and run it in a terminal”, but as a locked-down background service that starts on boot, runs under its own restricted account, and sits behind a firewall.
I wrote it because most of the install guides you’ll find are quietly out of date. They install Prometheus 2.x, copy a consoles/ directory that no longer ships, and never once run systemctl enable — so the day the server reboots, monitoring silently doesn’t come back. I installed the current release (3.13.1) from scratch on a fresh Ubuntu 24.04 box, hardened it, rebooted it to prove it survives, and captured what actually happened. Every command below is what I typed as a normal sudo user, and every output block underneath a command is what the machine printed back, pasted in unedited.
One honest caveat before you spend an afternoon on this: Prometheus is a metrics system, not a simple up/down checker. If all you want is “tell me when my website is down”, it’s heavier than you need — something like How to Self-Host Uptime Kuma for Free Server Monitoring with Docker will do that job with far less to run. Prometheus earns its place when you want time-series data — CPU, memory, request rates, custom app metrics — that you can graph over time and write alerting rules against. That’s what we’re building toward here.
What you need
- An Ubuntu 24.04 VPS you can reach over SSH, with a normal user that has
sudo(not root). If you don’t have a server yet, Getting Started with Lineserve Cloud: Launch Your First VPS walks through launching one. - About 2 GB of RAM is a comfortable floor. Scraping only itself, Prometheus used around 95 MB in my lab — but memory grows with the number of metrics you collect and how long you keep them, so leave headroom.
- Roughly 20 minutes.
Nothing else is assumed: curl, the dedicated user, the firewall, and the service are all set up below.
Conventions
Three values in this guide are yours to substitute. To keep the commands concrete I use fixed sample values throughout — wherever you see one, swap in your own:
- Prometheus version =
3.13.1. The current stable release the day I tested. Check the official Prometheus download page for today’s version and replace3.13.1everywhere it appears in a command. - Your server’s public IP =
198.51.100.20. The Ubuntu VPS you’re installing on. This is the address you’ll point a browser at to open the dashboard. - Your workstation’s IP =
203.0.113.10. The machine you sit at to browse the dashboard — the only address we’ll allow through the firewall to Prometheus. Find yours by runningcurl -s ifconfig.meon your laptop, or searching “what is my IP”.
Step 1 — Update the system and install curl
Start by refreshing the package index and installing the two small tools this guide leans on: curl (to download the release and test the server) and python3 (used once, near the end, to pretty-print a JSON response). Both ship with Ubuntu 24.04, so this is usually a no-op — but running it costs nothing and saves you a surprise on a stripped-down image:
sudo apt update
sudo apt install -y curl python3
Confirm curl is available — any recent version is fine:
curl --version
The first line of the reply tells you the version — anything recent is fine:
curl 8.5.0 (x86_64-pc-linux-gnu) libcurl/8.5.0 OpenSSL/3.0.13 zlib/1.3 brotli/1.1.0 zstd/1.5.5 libidn2/2.3.7 libpsl/0.21.2 (+libidn2/2.3.7) libssh/0.10.6/openssl/zlib nghttp2/1.59.0 librtmp/2.3 OpenLDAP/2.6.10
Step 2 — Download and verify the release
Prometheus ships as a single tarball of pre-compiled binaries — there’s nothing to compile. Get the Linux/amd64 build and its checksum file from the Prometheus download page (the URLs below point at the GitHub release the download page links to). Do this from your home directory:
cd ~
curl -LO https://github.com/prometheus/prometheus/releases/download/v3.13.1/prometheus-3.13.1.linux-amd64.tar.gz
curl -LO https://github.com/prometheus/prometheus/releases/download/v3.13.1/sha256sums.txt
Before trusting the download, check it wasn’t corrupted or tampered with in transit. This compares your file against the official checksum:
sha256sum -c sha256sums.txt 2>/dev/null | grep prometheus-3.13.1.linux-amd64.tar.gz
You want to see OK. If it says FAILED, delete the tarball and download it again — do not continue:
prometheus-3.13.1.linux-amd64.tar.gz: OK
Now unpack it:
tar xzf prometheus-3.13.1.linux-amd64.tar.gz
ls prometheus-3.13.1.linux-amd64/
Here’s the first place old guides will trip you up. The 3.x tarball contains just the two binaries, a sample config, and licence files — that’s all:
LICENSE
NOTICE
prometheus
prometheus.yml
promtool
Prometheus 2.x used to ship consoles/ and console_libraries/ directories, and countless tutorials still tell you to copy them and point the service at them with --web.console.templates flags. Those directories no longer exist in 3.x, and those flags will make the service fail to start. We won’t use them.
Step 3 — Create a dedicated system user
Running Prometheus as root, or as your own login user, is a needless risk: if the process is ever compromised, the attacker inherits those privileges. The standard fix is a locked-down system account that owns nothing but Prometheus and cannot be logged into.
Create it with no home directory and no login shell:
sudo useradd --system --no-create-home --shell /usr/sbin/nologin prometheus
Check the account looks right — a system UID and, crucially, /usr/sbin/nologin as its shell:
getent passwd prometheus
prometheus:x:999:988::/home/prometheus:/usr/sbin/nologin
That nologin shell isn’t decorative — it actively refuses interactive logins. You can prove it to yourself by trying to become the user:
sudo su - prometheus
Instead of a shell, you get a refusal and are dropped straight back where you started:
This account is currently not available.
Now make the two directories Prometheus needs — one for its configuration, one for the metrics database it will write:
sudo mkdir -p /etc/prometheus /var/lib/prometheus
Step 4 — Install the binaries and config
Copy the two programs onto the system path. prometheus is the server itself; promtool is a companion that validates configs and rules (we’ll use it in the troubleshooting section):
sudo cp prometheus-3.13.1.linux-amd64/prometheus /usr/local/bin/
sudo cp prometheus-3.13.1.linux-amd64/promtool   /usr/local/bin/
Put the sample configuration in place. It’s a sensible starting point — out of the box it tells Prometheus to scrape its own metrics, which is exactly what we want for a first run:
sudo cp prometheus-3.13.1.linux-amd64/prometheus.yml /etc/prometheus/
Hand ownership of the binaries, the config, and the data directory to the prometheus user so the service can read its config and write its database, and nothing else on the system is exposed:
sudo chown prometheus:prometheus /usr/local/bin/prometheus /usr/local/bin/promtool
sudo chown -R prometheus:prometheus /etc/prometheus /var/lib/prometheus
Confirm the binary runs and is the version you expect:
prometheus --version
prometheus, version 3.13.1 (branch: HEAD, revision: 73ff57ce2b8161059ac7fe5188f03f1c3d22b29a)
  build user:       root@6a98665b49f7
  build date:       20260710-08:18:27
  go version:       go1.26.5
  platform:         linux/amd64
  tags:             netgo,builtinassets
If you have a look at the config you just copied, the bottom of it explains a label you’ll see everywhere in the UI later:
cat /etc/prometheus/prometheus.yml
The default file defines one scrape job named prometheus, pointed at localhost:9090 (itself), and attaches a static label app: "prometheus" to everything from it:
global:
  scrape_interval: 15s # Set the scrape interval to every 15 seconds. Default is every 1 minute.
  evaluation_interval: 15s # Evaluate rules every 15 seconds. The default is every 1 minute.

scrape_configs:
  - job_name: "prometheus"
    static_configs:
      - targets: ["localhost:9090"]
        labels:
          app: "prometheus"
Step 5 — Run Prometheus as a systemd service
This is the step that separates a real install from a throwaway one. A systemd unit makes Prometheus start on boot, restart if it crashes, and run as the restricted user you just made.
Create the unit file. This here-document writes the whole file in one go — paste it exactly:
sudo tee /etc/systemd/system/prometheus.service > /dev/null <<'EOF'
[Unit]
Description=Prometheus
Wants=network-online.target
After=network-online.target

[Service]
User=prometheus
Group=prometheus
Type=simple
Restart=on-failure
ExecStart=/usr/local/bin/prometheus \
  --config.file=/etc/prometheus/prometheus.yml \
  --storage.tsdb.path=/var/lib/prometheus/ \
  --web.listen-address=0.0.0.0:9090

[Install]
WantedBy=multi-user.target
EOF
Two things worth understanding in that file. User=prometheus is what makes the service run as the locked-down account rather than root. And the ExecStart deliberately carries only three flags — the config path, the data path, and the address to listen on. That’s the complete, correct flag set for 3.x. If you copied an older guide’s --web.console.templates and --web.console.libraries flags in here, the service would refuse to start, because (as you saw in Step 2) those directories aren’t in the release any more.
Reload systemd so it notices the new file, then enable and start the service in one command. enable is the half almost every tutorial forgets — it’s what wires Prometheus to start at every boot:
sudo systemctl daemon-reload
sudo systemctl enable --now prometheus
enable --now both starts it immediately and registers it for boot, so systemd confirms the boot symlink it created:
Created symlink /etc/systemd/system/multi-user.target.wants/prometheus.service → /etc/systemd/system/prometheus.service.
Step 6 — Confirm it’s actually running
Check the service state:
sudo systemctl status prometheus
The line that matters is Active: active (running). You can also see it’s running as the prometheus user and loaded from the unit you wrote:
● prometheus.service - Prometheus
     Loaded: loaded (/etc/systemd/system/prometheus.service; enabled; preset: enabled)
     Active: active (running) since Sun 2026-07-19 09:51:14 UTC; 49ms ago
   Main PID: 1712 (prometheus)
      Tasks: 6 (limit: 2209)
     Memory: 11.3M (peak: 11.3M)
        CPU: 43ms
     CGroup: /system.slice/prometheus.service
             └─1712 /usr/local/bin/prometheus --config.file=/etc/prometheus/prometheus.yml --storage.tsdb.path=/var/lib/prometheus/ --web.listen-address=0.0.0.0:9090
(If instead you see Active: failed, jump to the troubleshooting section — a config typo is the usual cause, and promtool will point straight at it.)
Prometheus exposes a health endpoint you can hit locally without a browser. Ask it directly:
curl http://localhost:9090/-/healthy
Prometheus Server is Healthy.
Confirm it’s actually listening on port 9090, and note that the socket is owned by the prometheus user, not root:
sudo ss -tlnp | grep 9090
LISTEN 0 4096 *:9090 *:* users:(("prometheus",pid=601,fd=6))
Finally, prove it’s collecting data by asking it the most basic question there is — the up metric, which every target reports as 1 when a scrape succeeds. Prometheus has a full HTTP API; this queries it from the command line:
curl -s 'http://localhost:9090/api/v1/query?query=up' | python3 -m json.tool
A "value" ending in "1" means Prometheus successfully scraped its one target (itself):
{
    "status": "success",
    "data": {
        "resultType": "vector",
        "result": [
            {
                "metric": {
                    "__name__": "up",
                    "app": "prometheus",
                    "instance": "localhost:9090",
                    "job": "prometheus"
                },
                "value": [
                    1784454748.247,
                    "1"
                ]
            }
        ]
    }
}
Notice the app="prometheus" label — that’s the static label from the config file in Step 4, riding along on the metric exactly as configured.
Step 7 — Open the web UI safely
Everything works locally. Now to reach the dashboard from your own machine — which means opening port 9090 to the outside, and doing it carefully.
Understand the risk first. Prometheus has no built-in login. None. Anyone who can reach port 9090 can read every metric you collect and run queries against it. You saw this yourself in Step 6: curl fetched data with no password. So the rule is simple — never expose 9090 to the whole internet. Allow only the specific machine you browse from.
The clean way to do that is ufw, Ubuntu’s firewall. These three commands keep your SSH access, open 9090 to your workstation’s IP only, and switch the firewall on:
sudo ufw allow OpenSSH
sudo ufw allow from 203.0.113.10 to any port 9090 proto tcp
sudo ufw --force enable
Check the resulting rule set. Port 9090 should be reachable only from your workstation address, and the default policy for everything else inbound is deny:
sudo ufw status verbose
Status: active
Logging: on (low)
Default: deny (incoming), allow (outgoing), disabled (routed)
New profiles: skip

To                         Action      From
--                         ------      ----
22/tcp (OpenSSH)           ALLOW IN    Anywhere
9090/tcp                   ALLOW IN    203.0.113.10
22/tcp (OpenSSH (v6))      ALLOW IN    Anywhere (v6)
That rule means the kernel now drops any packet to 9090 whose source isn’t 203.0.113.10. One honest note on verifying it: you can’t meaningfully test the block from the server itself, because traffic a machine sends to its own address never traverses the firewall — it’ll always look “open” from there. Trust the rule set above, or confirm from a third machine on a different network that the port is closed to it. Locking the port to a single admin IP is a solid default; if you want it airtight, the stronger pattern is to bind Prometheus to 127.0.0.1:9090 in the unit file and reach the UI through an SSH tunnel instead — then port 9090 is never open at all. For the broader firewall and hardening picture on a new server, see 8 Essential Security Steps for Every Production VPS.
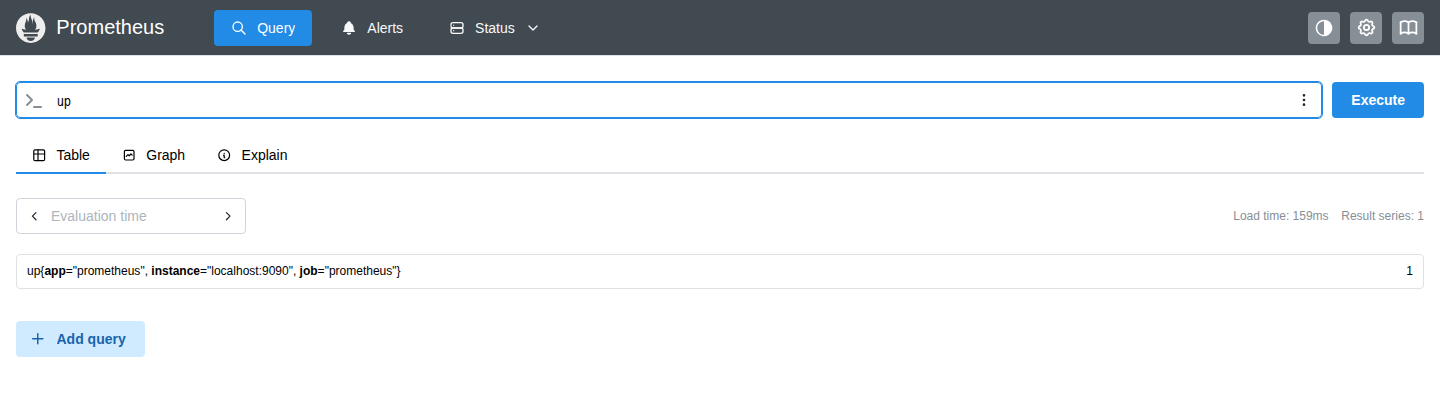
With the rule in place, open http://198.51.100.20:9090 in your browser (your server’s IP, port 9090). Prometheus opens on its Query page. Type up into the expression bar, leave the Table tab selected, and click Execute. You get the same answer the API gave you, now in the UI — a single series with value 1, meaning the target is being scraped:
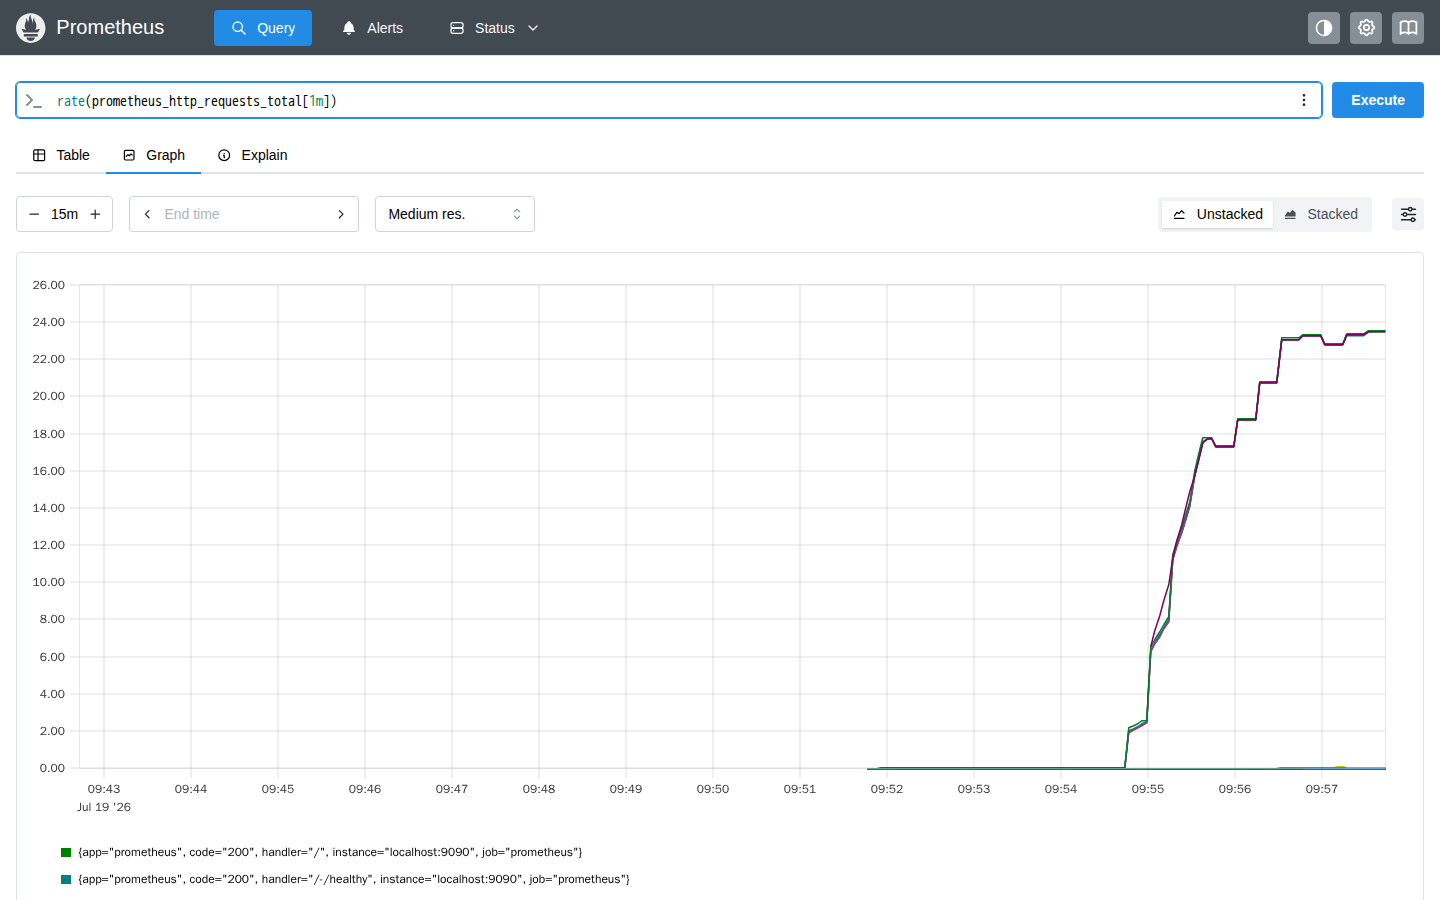
Switch to the Graph tab to see data over time. Any metric works, but a rate makes the point best — try rate(prometheus_http_requests_total[1m]) and set the range to 15m. In the shot below the line climbs partway through: that’s real traffic from a synthetic load test I ran against the lab server to give the graph something to show. On a brand-new install with no load, expect a much flatter line — that’s normal, not a fault:
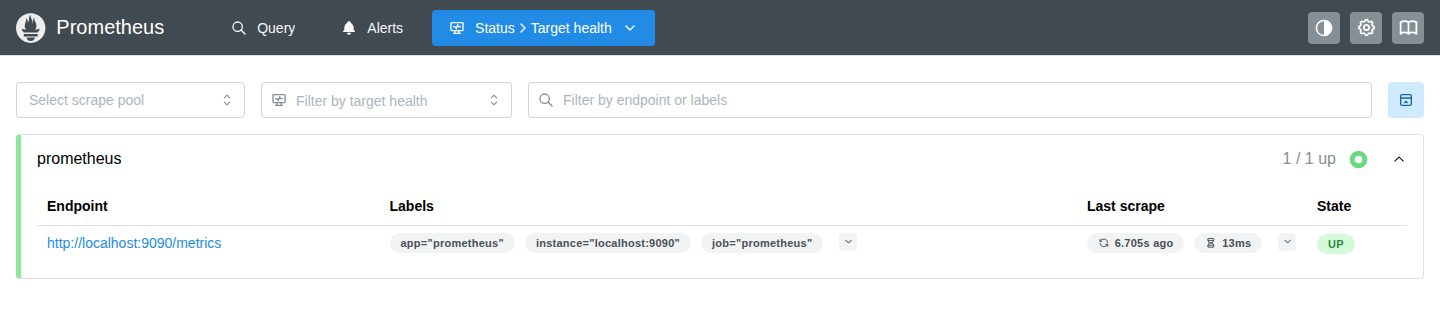
Finally, open Status → Target health from the top menu. This is where you’ll live once you add more things to monitor — it lists every target and whether the last scrape succeeded. Right now there’s exactly one, and it should be green and UP:
Step 8 — Prove it survives a reboot
This is the test that separates “it’s running now” from “it’s actually installed”. Because we ran systemctl enable in Step 5, Prometheus should come back on its own after a restart. Don’t take it on faith — reboot and check:
sudo systemctl reboot
Your SSH session will drop. Wait a minute, reconnect, and ask two questions: is the box freshly up, and did Prometheus start without anyone touching it?
uptime -p
systemctl is-active prometheus
A fresh uptime next to active is the whole proof — nothing started the service after the reboot except systemd itself:
up 0 minutes
active
You can double-check that systemd started it at boot rather than leaving it for you:
sudo systemctl status prometheus
● prometheus.service - Prometheus
     Loaded: loaded (/etc/systemd/system/prometheus.service; enabled; preset: enabled)
     Active: active (running) since Sun 2026-07-19 10:02:39 UTC; 40s ago
   Main PID: 601 (prometheus)
      Tasks: 8 (limit: 2209)
     Memory: 94.5M (peak: 101.9M)
The firewall came back too — ufw re-applies its rules at boot — but don’t take that on faith either. Check it the same way you checked the service:
sudo ufw status verbose
Still active after the reboot, with your 9090 rule locked to your workstation exactly as you left it:
Status: active
Logging: on (low)
Default: deny (incoming), allow (outgoing), disabled (routed)
New profiles: skip

To                         Action      From
--                         ------      ----
22/tcp (OpenSSH)           ALLOW IN    Anywhere
9090/tcp                   ALLOW IN    203.0.113.10
22/tcp (OpenSSH (v6))      ALLOW IN    Anywhere (v6)
That 94.5 MB of memory is a useful number to remember: it’s Prometheus scraping a single target after a short load test. Add more targets and longer retention and it climbs, which is why the sizing advice at the end isn’t just filler.
Troubleshooting
The service won’t start / shows Active: failed. Ninety percent of the time it’s the config. Before restarting blindly, validate the file — promtool (which you installed in Step 4) parses it exactly as Prometheus would:
promtool check config /etc/prometheus/prometheus.yml
A healthy config says so plainly:
Checking /etc/prometheus/prometheus.yml
 SUCCESS: /etc/prometheus/prometheus.yml is valid prometheus config file syntax
When something is wrong, promtool tells you the line. Here’s what a genuine error looks like — this is the real output from a config with a malformed job entry, not an illustration:
Checking /tmp/bad.yml
  FAILED: parsing YAML file /tmp/bad.yml: yaml: unmarshal errors:
  line 4: cannot unmarshal !!str `job_nam...` into config.ScrapeConfig
Fix the line it names, run promtool check config again until it says SUCCESS, then sudo systemctl restart prometheus.
You want to see the logs. systemd captures everything Prometheus prints. This shows the last lines, and it’s where startup problems surface:
sudo journalctl -u prometheus -n 20 --no-pager
A clean start ends with a “ready” line, and along the way it tells you the data retention — Prometheus keeps 15 days of metrics by default:
... msg="TSDB retention updated" duration=15d size=0B percentage=0
... msg="Server is ready to receive web requests."
The page won’t load in your browser. If the service is active locally (Step 6) but the browser times out, it’s the firewall or the address. Re-check sudo ufw status verbose and confirm the From address is genuinely your workstation’s current public IP — home and mobile connections change it more often than you’d think. Confirm you’re using your server’s IP and :9090, not localhost.
Permission-denied errors in the logs. These mean ownership didn’t take. Re-run the chown commands from Step 4 — the prometheus user must own /etc/prometheus and /var/lib/prometheus.
Where to go next
You now have a hardened Prometheus that starts on boot and survives reboots — but it’s only watching itself. The value comes from pointing it at real things, and you do that by adding exporters (small agents that expose metrics) as new targets in prometheus.yml.
Two natural next steps, both of which pick up exactly where this guide leaves off:
- To monitor network hardware over SNMP, the SNMP Exporter Installation Guide covers the SNMP exporter in depth.
- For a complete worked example — Prometheus scraping a device and Grafana drawing the dashboards on top — see How to Monitor a MikroTik Router with Prometheus and Grafana.
Sizing this on a Lineserve VPS
Prometheus is memory-bound, not CPU-bound: what grows your resource use is the number of active metric series and how long you retain them, not raw traffic. For a monitoring box watching a handful of targets at the default 15-day retention, the entry Linux VPS S1 (1 vCPU, 2 GB RAM, 20 GB SSD) is a sensible starting point at KES 1,746 / TZS 33,775 / NGN 21,616 per month (about $13.51). It comfortably fits the ~95 MB footprint I measured with headroom for a real workload. If you’re scraping dozens of targets or keeping months of history, step up to the M1 (2 vCPU, 4 GB RAM) so the metrics database has room to breathe.
You pay in your local currency — M-Pesa and mobile money, bank transfer, or card in Kenya and Tanzania, card or bank transfer in Naira in Nigeria — with no foreign-card or forex step, and the server sits in a locally-hosted region (Nairobi, Dar es Salaam, or Lagos). Spin up a Linux VPS for your monitoring stack and you can have Prometheus running on it in the twenty minutes this guide takes.