How to Monitor a MikroTik Router with Prometheus and Grafana
Monitor a MikroTik router with Prometheus and Grafana over SNMP: enable RouterOS SNMP, build the snmp_exporter module, and fix the No data trap.

How to Monitor a MikroTik Router with Prometheus and Grafana
By the end of this guide, Prometheus is scraping your MikroTik router over SNMP every 15 seconds, and a Grafana dashboard shows live interface throughput, CPU load, memory, and per-interface status — all pulled from the router itself, no agent installed on RouterOS.
This guide is scoped to one job: adding a MikroTik device as a monitoring target. It assumes you already have Prometheus and Grafana running — the How to Install Prometheus on Ubuntu 24.04 (Step by Step) covers standing up that stack from scratch. Here we focus on the parts that are actually MikroTik-specific: enabling SNMP on RouterOS, building the snmp_exporter module that speaks MikroTik’s OIDs, wiring the Prometheus scrape job, and getting a dashboard that shows real numbers instead of “No data”.
Every command below was run in order against a real RouterOS device, and the outputs are real captures from that run — I’ve only swapped the router’s address and identity for the placeholders you’ll substitute (ROUTER_IP, MONITOR_IP, and example contact/location values). The device under test is a RouterOS CHR 7.16.2 (MikroTik’s virtual router), running on an Ubuntu 24.04 box alongside the monitoring stack. A physical router — hEX, RB, CCR — exposes the same SNMP OIDs; the difference is the interface list and the hardware sensors, and I call out exactly where that matters.
Which exporter: SNMP, not the RouterOS API
There are two common ways to get MikroTik metrics into Prometheus, and picking the wrong one is the single biggest reason people end up staring at empty panels.
- SNMP + snmp_exporter (this guide). SNMP is built into RouterOS — you enable it with two commands and nothing runs on the router but its own SNMP daemon. Prometheus’ official snmp_exporter translates SNMP into Prometheus metrics. Metric names follow the SNMP MIBs: standard interface counters are
ifHCInOctets/ifHCOutOctets(from IF-MIB), and MikroTik’s own extras aremtxr...(from MIKROTIK-MIB). - A native RouterOS-API exporter (nshttpd/mikrotik-exporter, mktxp, and others). These log into the RouterOS API and emit metrics with their own names — nshttpd/mikrotik-exporter uses
mikrotik_interface_rx_byte,mikrotik_system_cpu_load, and so on; mktxp usesmktxp_*. They’re faster and richer per poll, but each is a separate service to run and secure, and none of their metric names match the SNMP names.
That naming split is the trap. A Grafana dashboard built for a native exporter queries mikrotik_* (or mktxp_*); point it at an snmp_exporter data source and every panel says “No data”, because those series don’t exist. We reproduce and fix that exact failure in Troubleshooting. SNMP wins here for one more reason worth stating plainly: it’s the path that already links cleanly into an existing Prometheus cluster with zero extra daemons on the router.
Prerequisites
- A running Prometheus + Grafana stack. If you don’t have one, follow the How to Install Prometheus on Ubuntu 24.04 (Step by Step) first.
snmp_exporterinstalled on the monitoring host — see the SNMP Exporter Installation Guide. We’ll replace its default config with a MikroTik-specific one below.- The
snmpcommand-line tools on the monitoring host for testing (apt-get install -y snmpon Ubuntu/Debian). - Admin access to the MikroTik router (Winbox, WebFig, or SSH) and network reachability from the monitoring host to the router on UDP 161.
Throughout, the monitoring host reaches the router at ROUTER_IP. In the lab the router answered on 127.0.0.1:1161; substitute your router’s real address.
Step 1 — Enable SNMP on RouterOS
SNMP is off by default. Enable it and set a read-only community. From the RouterOS terminal:
/snmp community set [find default=yes] name=public addresses=MONITOR_IP/32
/snmp set enabled=yes contact="netops" location="nairobi-rack-1"
The addresses=MONITOR_IP/32 is not optional hygiene — it restricts the community so only your monitoring host can query it. A community open to 0.0.0.0/0 is readable by anyone who can reach UDP 161. Lock it to the monitoring host’s IP, and keep the router’s firewall closed to 161 from everywhere else (the How to Set Up a Firewall with UFW on Ubuntu 24.04 covers the monitoring-host side; do the equivalent in /ip firewall filter on RouterOS).
A note on the community name:
publicis the conventional read-only name and it’s what every stock dashboard assumes. It is not a password — SNMPv2c sends it in clear text. Restrictingaddressesis what actually protects you. If you need secrecy on the wire, use SNMPv3 (/snmp communitywithauthentication-protocolandencryption-protocol); the exporter supports it via anauthblock, but SNMPv2c with a locked-down source IP is the common, workable baseline and what this guide verifies.
Confirm it’s live:
/snmp print
           enabled: yes
           contact: netops
          location: nairobi-rack-1
  engine-id-suffix:
         engine-id: 80003a8c04
       src-address: ::
       trap-community: public
      trap-version: 1
               vrf: main
Now prove it from the monitoring host — this is exactly what snmp_exporter will do, minus the Prometheus plumbing:
snmpget -v2c -c public -r 3 -t 4 ROUTER_IP 1.3.6.1.2.1.1.1.0   # sysDescr
snmpget -v2c -c public -r 3 -t 4 ROUTER_IP 1.3.6.1.2.1.1.5.0   # sysName
iso.3.6.1.2.1.1.1.0 = STRING: "RouterOS CHR"
iso.3.6.1.2.1.1.5.0 = STRING: "lab-mikrotik"
If sysDescr comes back, the whole chain will work. If it times out, SNMP isn’t reachable — jump to Troubleshooting before going further; nothing downstream can succeed until this does.
Step 2 — Build the snmp_exporter MikroTik module
snmp_exporter does not read MIBs at runtime. It reads a pre-compiled snmp.yml that maps OIDs to metric names, and you build that file with the exporter’s generator. The stock snmp.yml shipped in the release ships with a mikrotik module, but it walks only MikroTik’s enterprise tree — it gives you mtxr* metrics and skips the standard interface octet counters most dashboards actually graph. We’ll build a module that walks both: IF-MIB for traffic, HOST-RESOURCES-MIB for CPU and memory, and MIKROTIK-MIB for the MikroTik-specific health and per-interface stats.
Install the generator and MIBs
The generator is a Go program that uses net-snmp’s MIB parser, so it needs Go, the net-snmp headers, and a set of MIB files:
apt-get install -y golang-go make git libsnmp-dev snmp-mibs-downloader
download-mibs   # populates /var/lib/mibs with the IETF/IANA standard MIBs

git clone --depth 1 --branch v0.30.1 https://github.com/prometheus/snmp_exporter.git
cd snmp_exporter/generator
make mibs        # downloads the vendor MIB set, including MIKROTIK-MIB
go build -o generator .
Two things that will bite you here, both real (I hit them):
go buildfails withmodule cache not found: neither GOMODCACHE nor GOPATH is setif you’re building in a bare environment (cron, CI, an SSM session). SetHOMEand the Go paths first:export HOME=/root GOPATH=/root/go GOCACHE=/root/.cache/go-build.make mibspulls a large vendor set and may abort on a single upstream URL that returns 403. That’s fine — the MIBs we need (IF-MIB, HOST-RESOURCES-MIB, MIKROTIK-MIB) download early. If two standard imports are missing (SNMPv2-CONF,IANA-IFTYPE-MIB), copy them from thesnmp-mibs-downloaderset:cp /var/lib/mibs/ietf/SNMPv2-CONF /var/lib/mibs/iana/IANAifType-MIB mibs/.
Write the module definition
Create mikrotik.generator.yml in the generator/ directory. This is the file you edit; snmp.yml is generated from it.
auths:
  public_v2:
    community: public
    version: 2
modules:
  mikrotik:
    walk:
      - sysUpTime
      - sysName
      - ifTable            # IF-MIB: ifDescr, ifOperStatus, ifSpeed, ifIn/OutErrors
      - ifXTable           # IF-MIB: ifName, ifHCInOctets, ifHCOutOctets, ifHighSpeed
      - hrProcessorLoad    # HOST-RESOURCES-MIB: per-CPU load
      - hrStorageTable     # HOST-RESOURCES-MIB: RAM + disk usage
      - mtxrHealth         # MIKROTIK-MIB: voltage/temperature sensors (hardware only)
      - mtxrInterfaceStatsTable  # MIKROTIK-MIB: per-interface RX/TX bytes + errors
    lookups:
      - source_indexes: [ifIndex]
        lookup: ifName
      - source_indexes: [ifIndex]
        lookup: ifDescr
      - source_indexes: [mtxrInterfaceStatsIndex]
        lookup: ifName
    overrides:
      ifName:  { type: DisplayString }
      ifDescr: { type: DisplayString }
      ifAlias: { type: DisplayString }
The lookups block is what turns a metric labelled ifIndex="2" into one labelled ifName="ether1" — without it your dashboard legends are just numbers.
Generate snmp.yml
export MIBDIRS=$PWD/mibs
./generator generate --no-fail-on-parse-errors -m ./mibs -g mikrotik.generator.yml -o snmp.yml
--no-fail-on-parse-errors matters. The generator refuses to run if any MIB in the directory has a parse error, and the vendor MIB bundle from make mibs contains a few (Palo Alto and Arista MIBs that import an ENTITY-MIB the bundle doesn’t include). Those have nothing to do with MikroTik; the flag downgrades them to warnings and lets your module build:
level=WARN source=main.go:177 msg="NetSNMP reported parse error(s)" errors=13
You now have an snmp.yml whose mikrotik module carries the metric names we want. Move it into place:
cp snmp.yml /etc/snmp_exporter/snmp.yml
systemctl restart snmp_exporter
Step 3 — Test the scrape through snmp_exporter
Before touching Prometheus, query the exporter by hand. This is the single most useful debugging URL in the whole setup — it makes the exporter perform a live SNMP walk of the router and hand back Prometheus text:
curl -s "http://127.0.0.1:9116/snmp?target=ROUTER_IP&module=mikrotik&auth=public_v2"
The three query parameters are the whole contract: target is the router, module selects your mikrotik module, auth selects the public_v2 credentials. Real output (trimmed to the interesting lines):
snmp_scrape_pdus_returned{module="mikrotik"} 237
snmp_scrape_duration_seconds{module="mikrotik"} 0.826657973
sysUpTime 135600
ifHCInOctets{ifDescr="",ifIndex="2",ifName="ether1"} 308677
ifHCOutOctets{ifDescr="",ifIndex="2",ifName="ether1"} 3.266181e+06
ifHighSpeed{ifDescr="",ifIndex="2",ifName="ether1"} 1000
ifOperStatus{ifDescr="ether1",ifIndex="2",ifName="ether1"} 1
hrProcessorLoad{hrDeviceIndex="1"} 31
snmp_scrape_pdus_returned above zero and the if* counters carrying an ifName label mean the walk and the lookups both worked. If snmp_scrape_pdus_returned is 0, the exporter reached the router but got nothing back — almost always a community-string or addresses mismatch from Step 1.
Step 4 — Add the Prometheus scrape job
Here is the part people get subtly wrong. With snmp_exporter you do not point Prometheus at the router directly, and you do not point it at the exporter’s /metrics. You point it at the router’s address but rewrite the request so the exporter does the SNMP work. That’s the relabel dance below.
Add this to prometheus.yml:
scrape_configs:
  # The exporter's own health (optional but handy)
  - job_name: snmp_exporter
    static_configs:
      - targets: ['127.0.0.1:9116']

  # The MikroTik device, scraped THROUGH snmp_exporter
  - job_name: mikrotik
    metrics_path: /snmp
    params:
      module: [mikrotik]
      auth: [public_v2]
    static_configs:
      - targets:
          - ROUTER_IP          # the router, NOT the exporter
        labels:
          device: edge-router-1
    relabel_configs:
      - source_labels: [__address__]
        target_label: __param_target
      - source_labels: [__param_target]
        target_label: instance
      - target_label: __address__
        replacement: 127.0.0.1:9116   # snmp_exporter does the SNMP query
Read the relabel_configs top to bottom: take the target (ROUTER_IP), pass it as the target URL parameter, keep it as the instance label so your metrics are tagged by device, then overwrite the address Prometheus actually connects to with the exporter’s. To add a second router, add another entry under targets — one exporter serves them all.
Check the config and reload:
promtool check config /etc/prometheus/prometheus.yml
systemctl reload prometheus   # or: curl -X POST http://127.0.0.1:9090/-/reload
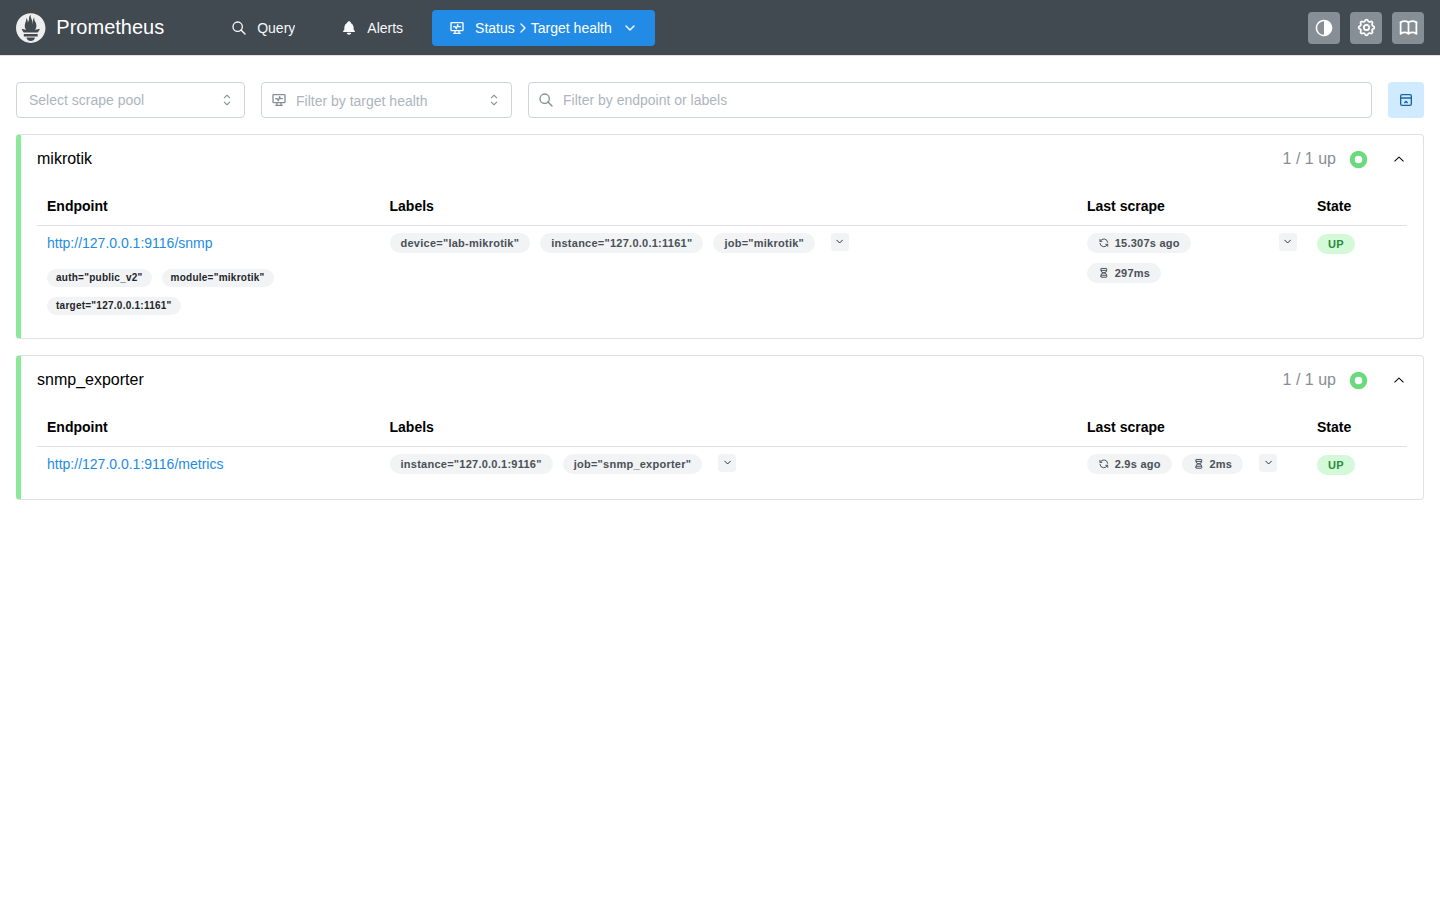
Open Status → Target health in the Prometheus UI. Both jobs should be green, and the mikrotik target should show its labels — device, module="mikrotik", target=ROUTER_IP — with a scrape time in the low hundreds of milliseconds.
Step 5 — Build the Grafana dashboard
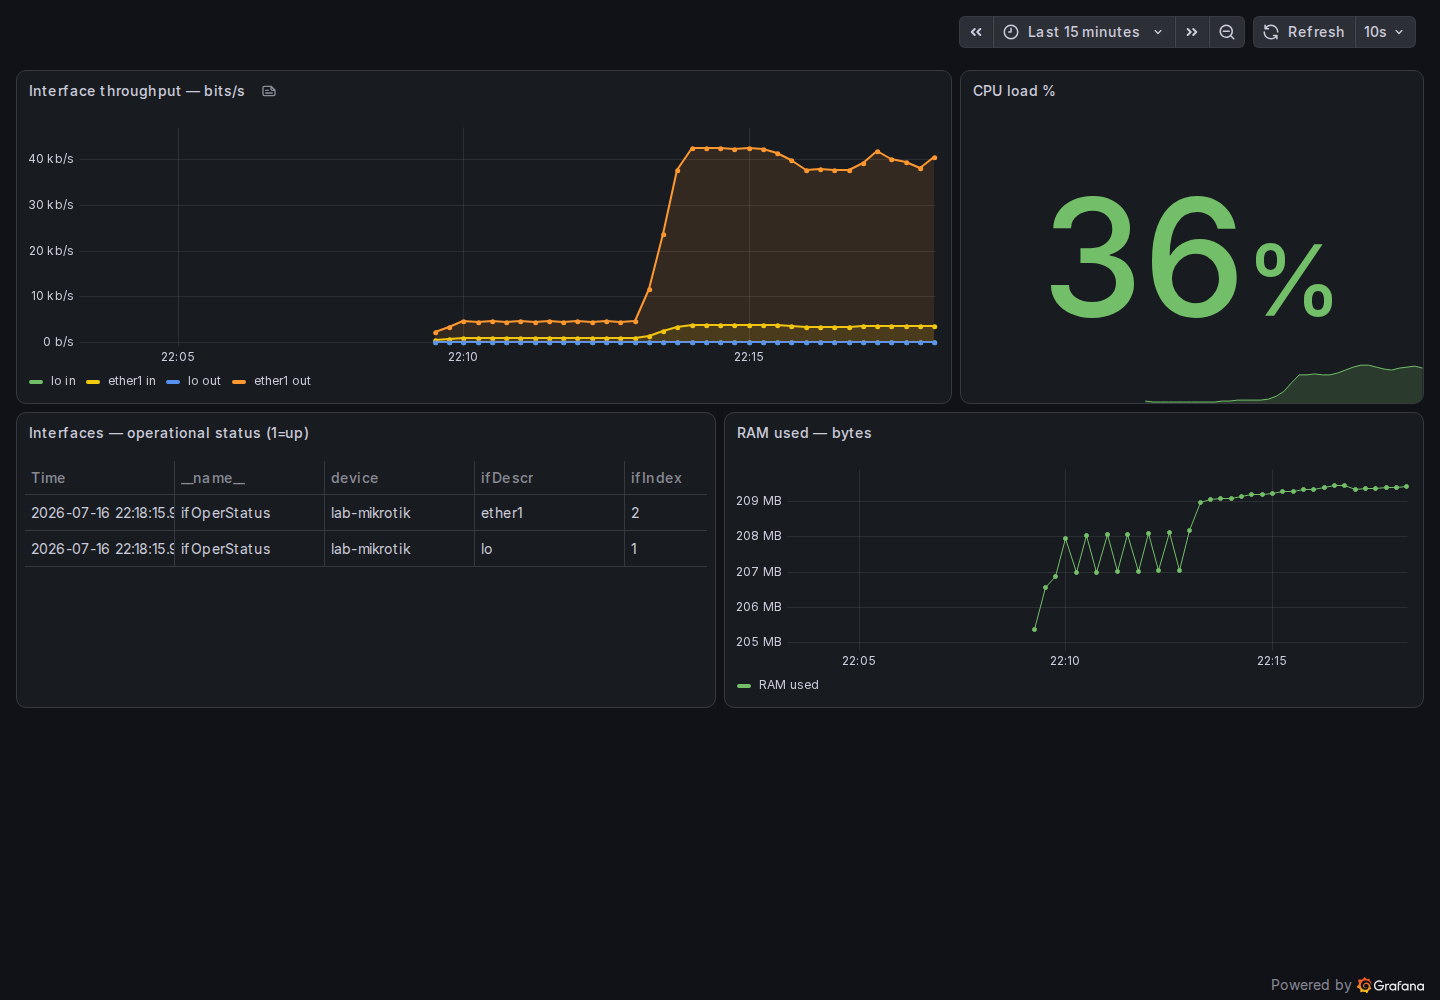
With data flowing into Prometheus, Grafana is the easy part — if your panels query the IF-MIB / mtxr* names snmp_exporter actually produces. The reliable route is to build a small board from the four queries below; that’s what the screenshot shows, and every panel is verified against the live router. If you’d rather start from a community dashboard, Grafana 14857 (“Mikrotik”) is documented as an snmp_exporter board (it scrapes with module: [mikrotik]) — import it, but confirm each panel lights up before trusting it, since community SNMP boards vary in which OIDs they expect.
The panels that matter are all simple PromQL:
- Interface throughput (bits/s):
rate(ifHCInOctets{device="edge-router-1"}[1m]) * 8and the same forifHCOutOctets. The* 8converts bytes to bits;rate(...[1m])turns the ever-increasing counter into a per-second rate. - CPU load (%):
hrProcessorLoad{device="edge-router-1"}. - Interface status:
ifOperStatus{device="edge-router-1"}—1is up,2is down. - RAM used (bytes):
hrStorageUsed{device="edge-router-1", hrStorageIndex="65536"} * 1024. The* 1024converts storage allocation units to bytes; MikroTik reports RAM in 1024-byte units, so this is correct here, but the portable form multiplies by the reported unit —hrStorageUsed * on(hrStorageIndex) group_left hrStorageAllocationUnits— and reads the RAM index fromhrStorageDescrrather than hardcoding it.
Point the panels at your Prometheus data source and you get live graphs. Here’s a purpose-built board reading the lab router while test traffic ran across ether1:
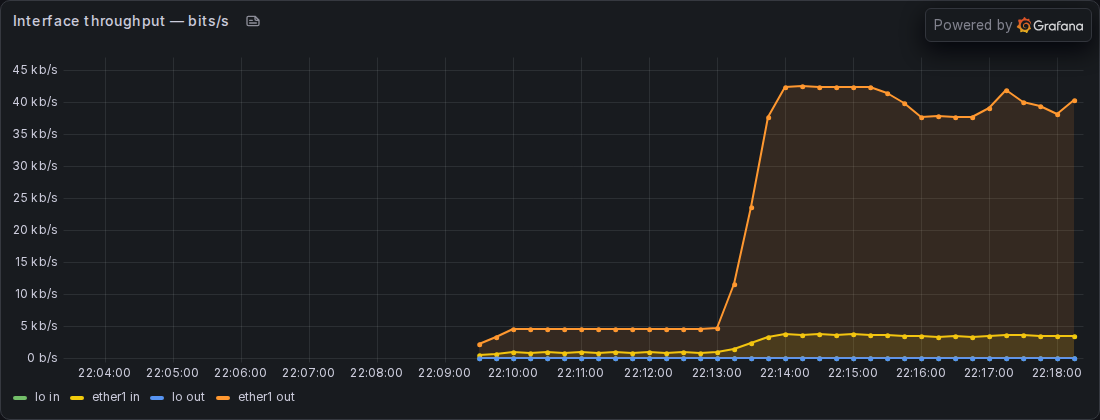
The throughput panel on its own, showing the rate() of ifHCInOctets/ifHCOutOctets for ether1 as traffic ramps up:
Verify it works
Two quick checks confirm the pipeline end to end. First, in the Prometheus UI (or via the API), confirm the interface counter exists and is increasing:
curl -s -G http://127.0.0.1:9090/api/v1/query \
  --data-urlencode 'query=rate(ifHCInOctets{ifName="ether1"}[1m])*8'
A non-empty result with a value that moves when traffic flows means Prometheus is storing and rating the counter. Second, confirm the target’s own health metric:
curl -s -G http://127.0.0.1:9090/api/v1/query --data-urlencode 'query=up{job="mikrotik"}'
1 means the last scrape succeeded. In the lab this job returned 247 series per scrape from a two-interface router; a real router with a dozen interfaces and VLANs returns proportionally more.
Troubleshooting
The dashboard says “No data” (the classic MikroTik trap)
You imported a popular MikroTik dashboard, the target is green, PromQL queries return data — and every panel is empty. This is the mismatch from the top of the guide, and it’s worth seeing. Here’s Grafana dashboard 10950 (“Mikrotik Exporter”) pointed at our snmp_exporter data source:
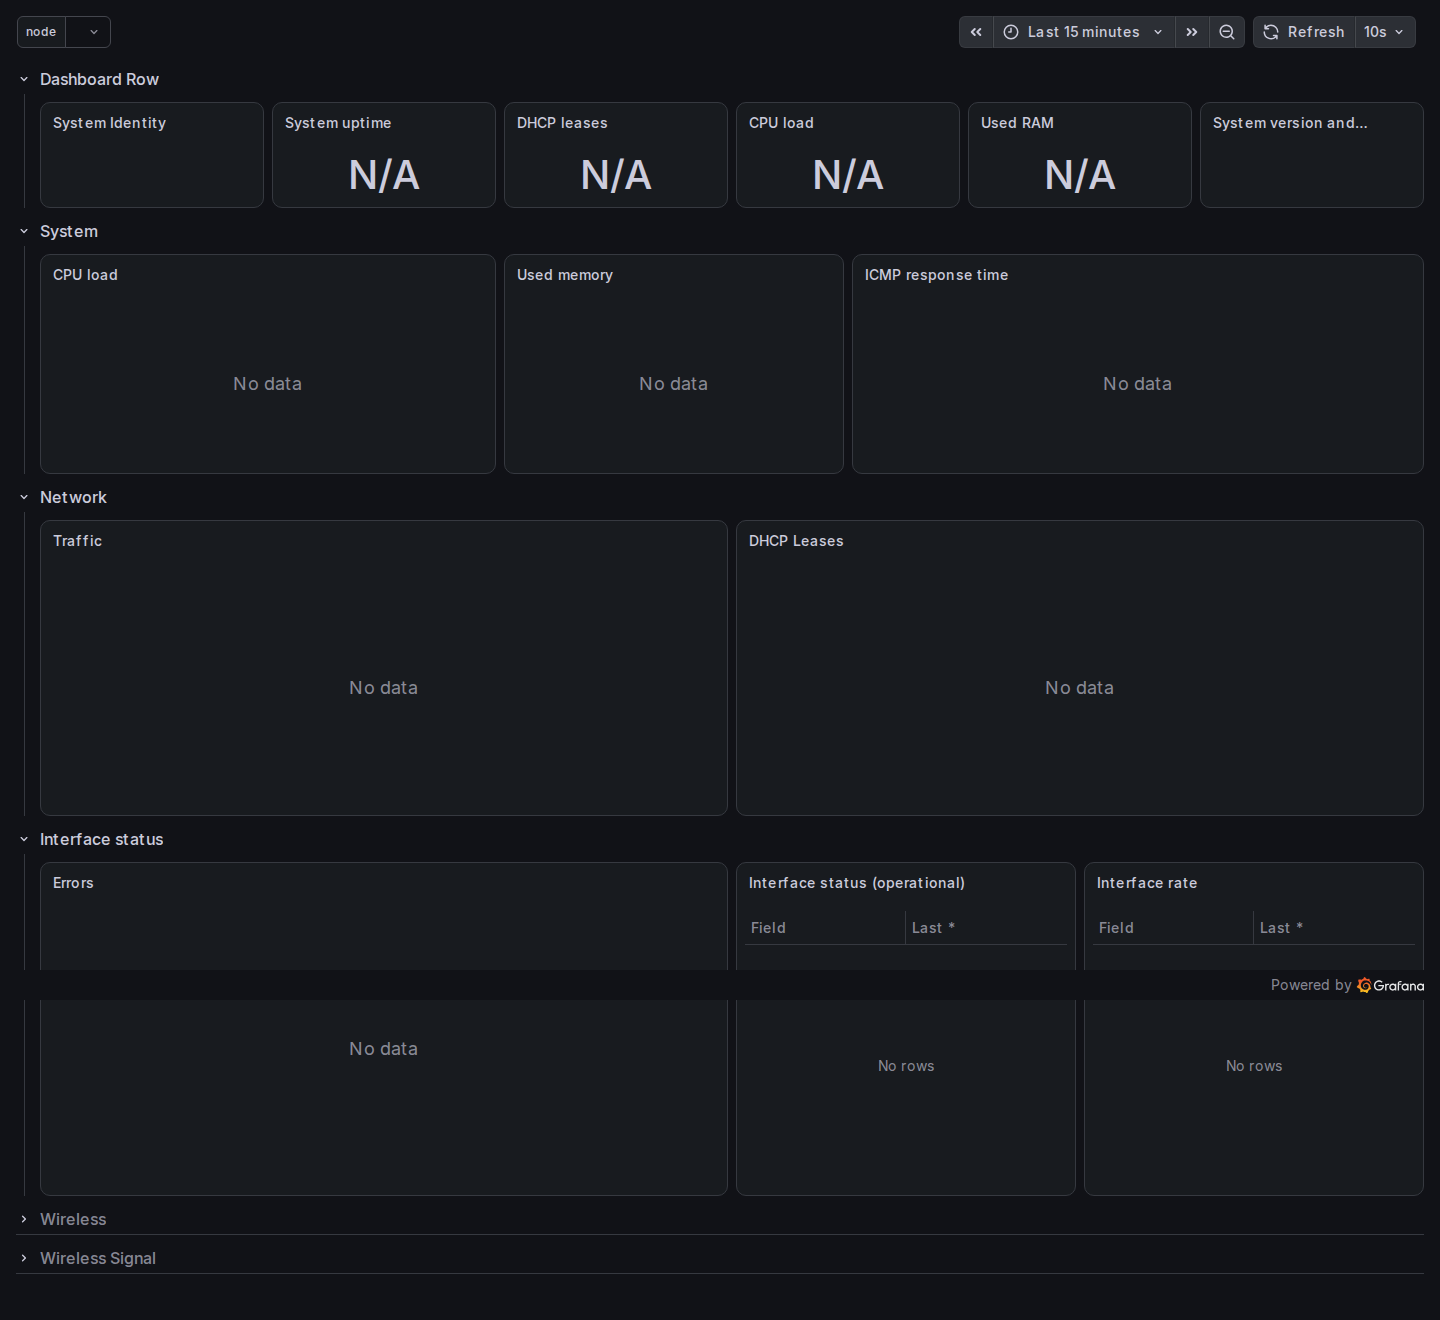
Every panel is N/A or “No data” because that dashboard was built for a native RouterOS-API exporter — specifically nshttpd/mikrotik-exporter. Its panels query mikrotik_system_cpu_load, mikrotik_interface_rx_byte, mikrotik_system_total_memory — metric names snmp_exporter never produces. You can prove it in one line:
# native mikrotik-exporter names — nothing:
curl -s -G http://127.0.0.1:9090/api/v1/query --data-urlencode 'query=mikrotik_system_cpu_load'
#  -> "result": []

# the SNMP equivalents you DO have:
curl -s -G http://127.0.0.1:9090/api/v1/query --data-urlencode 'query=hrProcessorLoad'
#  -> one series, value 31
The fix: use a dashboard built for SNMP/snmp_exporter (the panels in Step 5, or community dashboard 14857 once you’ve confirmed it lights up), or — if you’re attached to a native-exporter dashboard — rewrite each panel’s query to the IF-MIB / HOST-RESOURCES / mtxr* equivalent. The translation table you’ll reach for most, for nshttpd/mikrotik-exporter names: mikrotik_interface_rx_byte → ifHCInOctets, mikrotik_interface_tx_byte → ifHCOutOctets, mikrotik_system_cpu_load → hrProcessorLoad, mikrotik_system_free_memory → hrStorageSize - hrStorageUsed.
The MikroTik health sensors (temperature, voltage) read 0
If you graph mtxrHlCpuTemperature, mtxrHlVoltage, or the fan/PSU sensors and they’re all 0, that’s expected on a router with no such hardware. On the virtual CHR used to verify this guide, every mtxrHl* sensor returns 0 because there’s no physical board to read. A physical hEX, RB, or CCR populates the sensors it actually has — but even among physical models the set varies (a hEX has no fan tach; a CCR does). Treat these as best-effort extras, not guaranteed metrics, and don’t build alerts on a sensor you haven’t confirmed returns a real value on your model.
The Prometheus target is DOWN
Check the lastError on the Target health page. The usual causes, in order:
- Context deadline exceeded / timeout: UDP 161 is blocked between the monitoring host and the router, or the router’s firewall drops it. Confirm with the Step 1
snmpget; if that hangs too, it’s a network/firewall problem, not a Prometheus one. unexpected status code 400from the exporter: themoduleorauthname in the scrape job doesn’t match a block insnmp.yml. The names aremikrotikandpublic_v2here — they must match your generator file exactly.- Target is up but
snmp_scrape_pdus_returnedis 0: SNMP reached the router but the community was rejected. Re-checkaddressesin/snmp communityincludes the monitoring host, and the community name matches.
go build or the generator fails
module cache not found means the Go environment isn’t set — export HOME, GOPATH, and GOCACHE as shown in Step 2. If generator generate exits on Missing MIB ... errors from unrelated vendor MIBs, add --no-fail-on-parse-errors. If it can’t resolve a name you referenced (e.g. mtxrInterfaceStatsTable), the MIKROTIK-MIB isn’t in your -m directory — confirm make mibs fetched it or copy it in manually.
Where the lab differs from your router
This guide was verified on a RouterOS CHR 7.16.2 — MikroTik’s virtual router — because it exposes the identical SNMP OID tree to a physical device while being reproducible in a lab. What that means for you:
- The SNMP configuration, the module, the scrape job, and the PromQL are identical on a physical router. Nothing in Steps 1–5 changes.
- The interface list differs. The CHR had
loandether1; your hEX/RB/CCR has its real ports, plus any bridges, VLANs, and wireless interfaces — all of which show up the same way, indexed byifName. - The hardware sensors differ, as covered above. CHR reports none; physical routers report the subset they have.
Everything shown here — the counters, the CPU and memory, the “No data” fix — is real output from that live router, not a mock-up.
Run the monitoring stack on a VPS that’s close to your routers
Prometheus, snmp_exporter, and Grafana are light — the whole stack plus a handful of MikroTik targets runs comfortably on a 2 vCPU / 4 GB box. What matters more than raw size is where it runs: SNMP polling and alerting are only as timely as the network path between the monitoring host and your routers, and a scrape that crosses an ocean and back adds latency and failure modes you don’t want in your alerting path.
A Lineserve Linux VPS in Nairobi (ke-1a), Dar es Salaam (tz-1a), or Lagos (ng-1a) puts the monitoring host in the same region as the routers it watches — and you pay in KES, TZS, or NGN with no forex card required. The M1 plan (2 vCPU, 4 GB RAM, 80 GB SSD) is a comfortable home for this stack and a growing set of targets. If you also want simple up/down alerting alongside these metrics, the How to Self-Host Uptime Kuma for Free Server Monitoring with Docker pairs well with everything here. Spin one up at cloud.lineserve.net.