How to Self-Host Uptime Kuma for Free Server Monitoring with Docker
Install Uptime Kuma — a free, open-source, self-hosted uptime monitor — on your VPS with one Docker command. Create an admin account, add your first monitor, and get alerted the moment a site or API goes down.
Your server can go down at 3 a.m. and, without monitoring, the first person to find out is your customer — not you. Uptime monitoring flips that around: the moment a site, API, or service stops responding, you get the alert. And you don’t need an expensive SaaS plan to do it — Uptime Kuma is a free, open-source, self-hosted monitoring tool you can run on your own VPS in about two minutes with a single Docker command.
In this tutorial we’ll install it, create an admin account, add a monitor, and read the dashboard — with real output and screenshots from a live install. Everything here was run on a fresh Ubuntu server; follow along on yours.
What you’ll need
- A VPS running Ubuntu (22.04 or 24.04) with sudo access.
- Docker installed (we’ll cover that in one step).
- About 512 MB of free RAM — Uptime Kuma is very light.
Step 1: Install Docker
If Docker isn’t already on your server, the official convenience script is the fastest way to get a current version:
curl -fsSL https://get.docker.com | sudo shConfirm it’s working:
docker --versionYou should see something like Docker version 29.2.1, build a5c7197. If you get a “permission denied” error running Docker without sudo, add your user to the docker group with sudo usermod -aG docker $USER and log back in.
Step 2: Launch Uptime Kuma
This is the whole install — one command:
docker run -d --restart=unless-stopped \
  -p 3001:3001 \
  -v uptime-kuma:/app/data \
  --name uptime-kuma \
  louislam/uptime-kuma:1
Here’s what each flag does, because these are the parts people get wrong:
-d— run in the background (detached).--restart=unless-stopped— bring the container back automatically after a crash or a server reboot. Without this, a reboot silently kills your monitoring.-p 3001:3001— expose the web UI on port 3001.-v uptime-kuma:/app/data— the important one. This stores all your monitors and settings in a named Docker volume that survives container upgrades and removal. Leave it out and you lose everything the moment you recreate the container.
The first run pulls the image and starts the container:
4f4fb700ef54: Pull complete
ad1253342b11: Pull complete
Digest: sha256:3d632903e6af34139a37f18055c4f1bfd9b7205ae1138f1e5e8940ddc1d176f9
Status: Downloaded newer image for louislam/uptime-kuma:1
37cc155cfa0a6c642568d27b1e388b27a091066d6d490d0d3c1ce2894e904360
That last line is your container ID — Uptime Kuma is now running.
Step 3: Confirm the container is up
Check its status with docker ps:
docker ps --filter name=uptime-kuma

NAMES          IMAGE                    STATUS                   PORTS
uptime-kuma    louislam/uptime-kuma:1   Up 20 seconds (healthy)  0.0.0.0:3001->3001/tcp
Up and (healthy) mean you’re good. The service boots in a couple of seconds.
Firewall note: if you’re running
ufw, allow the port before you try to reach it:sudo ufw allow 3001. Better still, keep 3001 closed to the world and put Uptime Kuma behind Nginx with HTTPS — see the last step.
Step 4: Create your admin account
Open http://YOUR_SERVER_IP:3001 in your browser. On first launch Uptime Kuma shows a setup screen — pick a language, then choose a username and a strong password. This account is the only thing standing between the public and your monitoring, so don’t reuse a throwaway password.
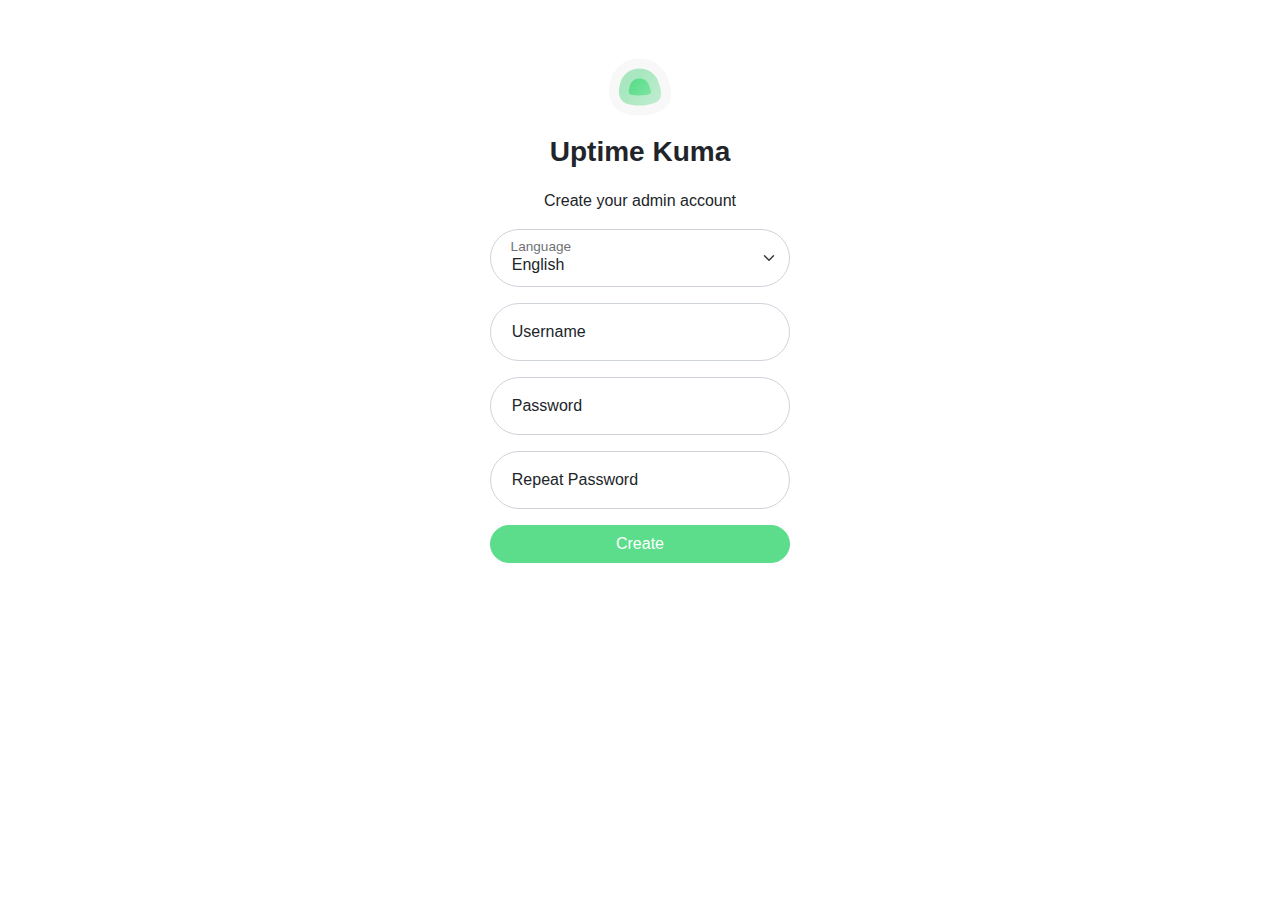
Click Create and you’re dropped straight into an empty dashboard.
Step 5: Add your first monitor
Click Add New Monitor in the top left. The only two fields you need to start are:
- Monitor Type — leave it on
HTTP(s)for a website or API. - Friendly Name — a label for the dashboard, e.g. “Lineserve Website”.
- URL — the full address to check, e.g.
https://www.lineserve.net.
The default Heartbeat Interval of 60 seconds is fine for most sites — it checks every minute. Scroll down and click Save.
Uptime Kuma runs the first check immediately. Within seconds you’ll see a green toast like [Lineserve Website] [Up] 200 - OK and the monitor turns green.
Step 6: Read your dashboard
The monitor detail page is where the value lives:
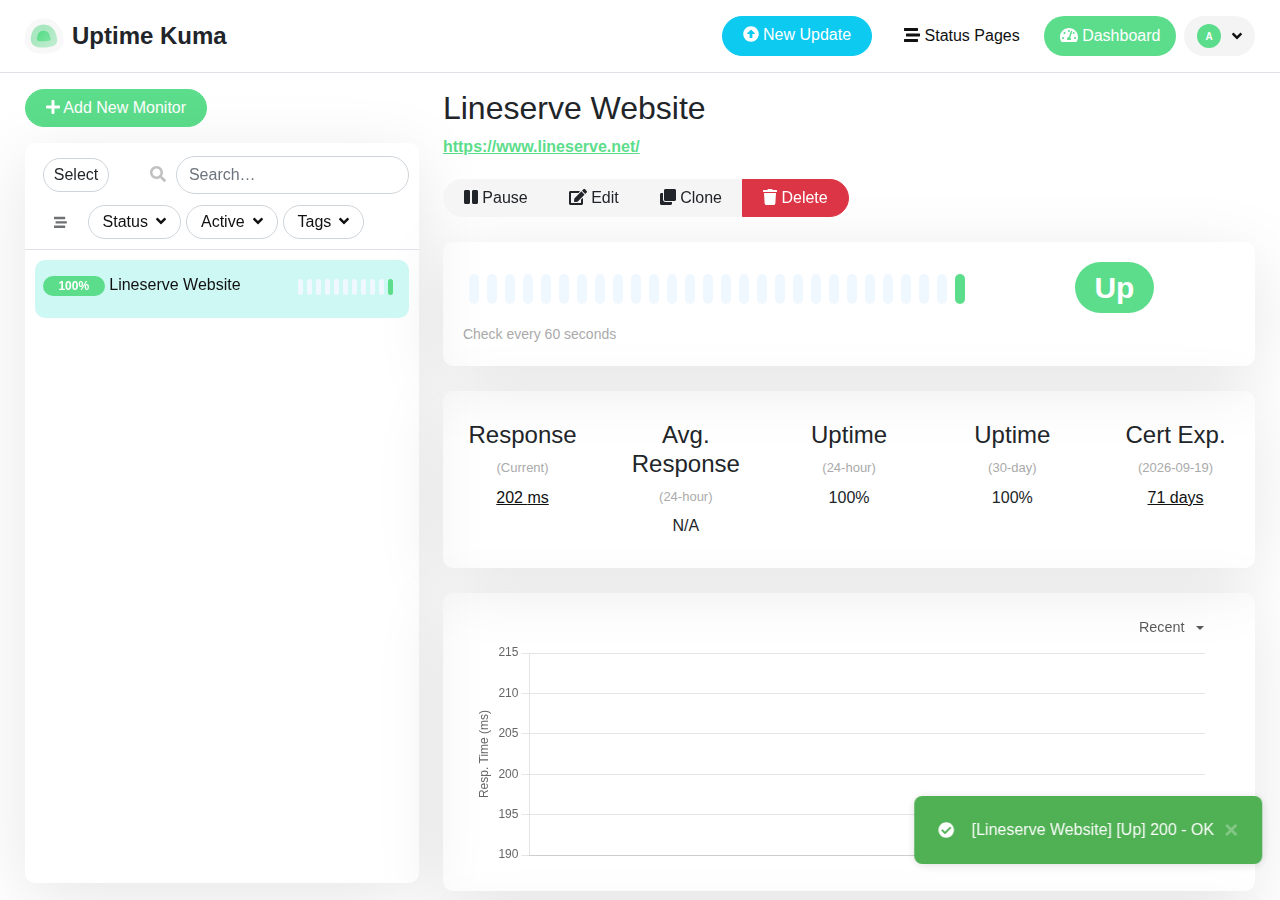
At a glance you get:
- Up / Down status — the big pill, plus a heartbeat bar of recent checks.
- Response time — here the site answered in 202 ms, with a live graph over time. Rising response times are an early warning long before an outage.
- Uptime % — rolling 24-hour and 30-day availability.
- Certificate expiry — for HTTPS monitors, Uptime Kuma reads your SSL cert and counts down (71 days here). That alone has saved countless teams from an embarrassing expired-certificate outage.
Step 7: Turn on notifications
A dashboard you have to remember to look at isn’t monitoring. Go to Settings → Notifications → Setup Notification and pick a channel — Uptime Kuma supports Telegram, Slack, Discord, email (SMTP), webhooks, and 90+ others. Add the notification, then edit each monitor to attach it. Now a downtime pings your phone instead of waiting for a customer complaint.
Step 8: Put it behind a domain with HTTPS
Reaching your monitor by raw IP and port is fine for testing, but for daily use you want a real URL and encryption. The pattern is the same reverse-proxy setup you’d use for any app: point a subdomain like status.yourdomain.com at your server, then have Nginx forward it to Uptime Kuma on localhost:3001:
server {
    listen 80;
    server_name status.yourdomain.com;

    location / {
        proxy_pass http://localhost:3001;
        proxy_http_version 1.1;
        proxy_set_header Upgrade $http_upgrade;
        proxy_set_header Connection 'upgrade';
        proxy_set_header Host $host;
        proxy_set_header X-Forwarded-For $proxy_add_x_forwarded_for;
        proxy_set_header X-Forwarded-Proto $scheme;
    }
}
The Upgrade / Connection headers matter here — Uptime Kuma uses WebSockets for its live dashboard, and it won’t load without them. Enable the site, then run sudo certbot --nginx -d status.yourdomain.com to add a free Let’s Encrypt certificate. Now close port 3001 in your firewall so the only way in is through HTTPS.
Keeping it updated
Because we pinned the image to the 1 major tag and mounted a data volume, upgrading is safe and boring — exactly what you want from monitoring:
docker pull louislam/uptime-kuma:1
docker stop uptime-kuma
docker rm uptime-kuma
# then re-run the same docker run command from Step 2
Your monitors, history, and settings all live in the uptime-kuma volume, so they survive the recreate untouched.
Wrapping up
In a handful of commands you’ve stood up a self-hosted monitoring stack that checks your services every minute, watches your SSL certificates, graphs response times, and alerts you the instant something breaks — all for the cost of a little RAM on a server you already run.
Monitoring is most useful when it lives close to what it watches and stays up independently of it. A small, always-on VPS is the ideal home for it. Spin up a Lineserve cloud server in Nairobi, Dar es Salaam, or Lagos, drop Uptime Kuma on it, and never learn about an outage from a customer again.